Data Lake - Custom Source monitor
The Custom Source option in Data Lake allows you to push data from your applications using APIs or SDKs. This enables seamless monitoring and analysis, giving you complete control over your custom metrics.
Get started
Follow the below steps to push data via Custom Source
- Click Integrate Now next to Custom Source to begin.
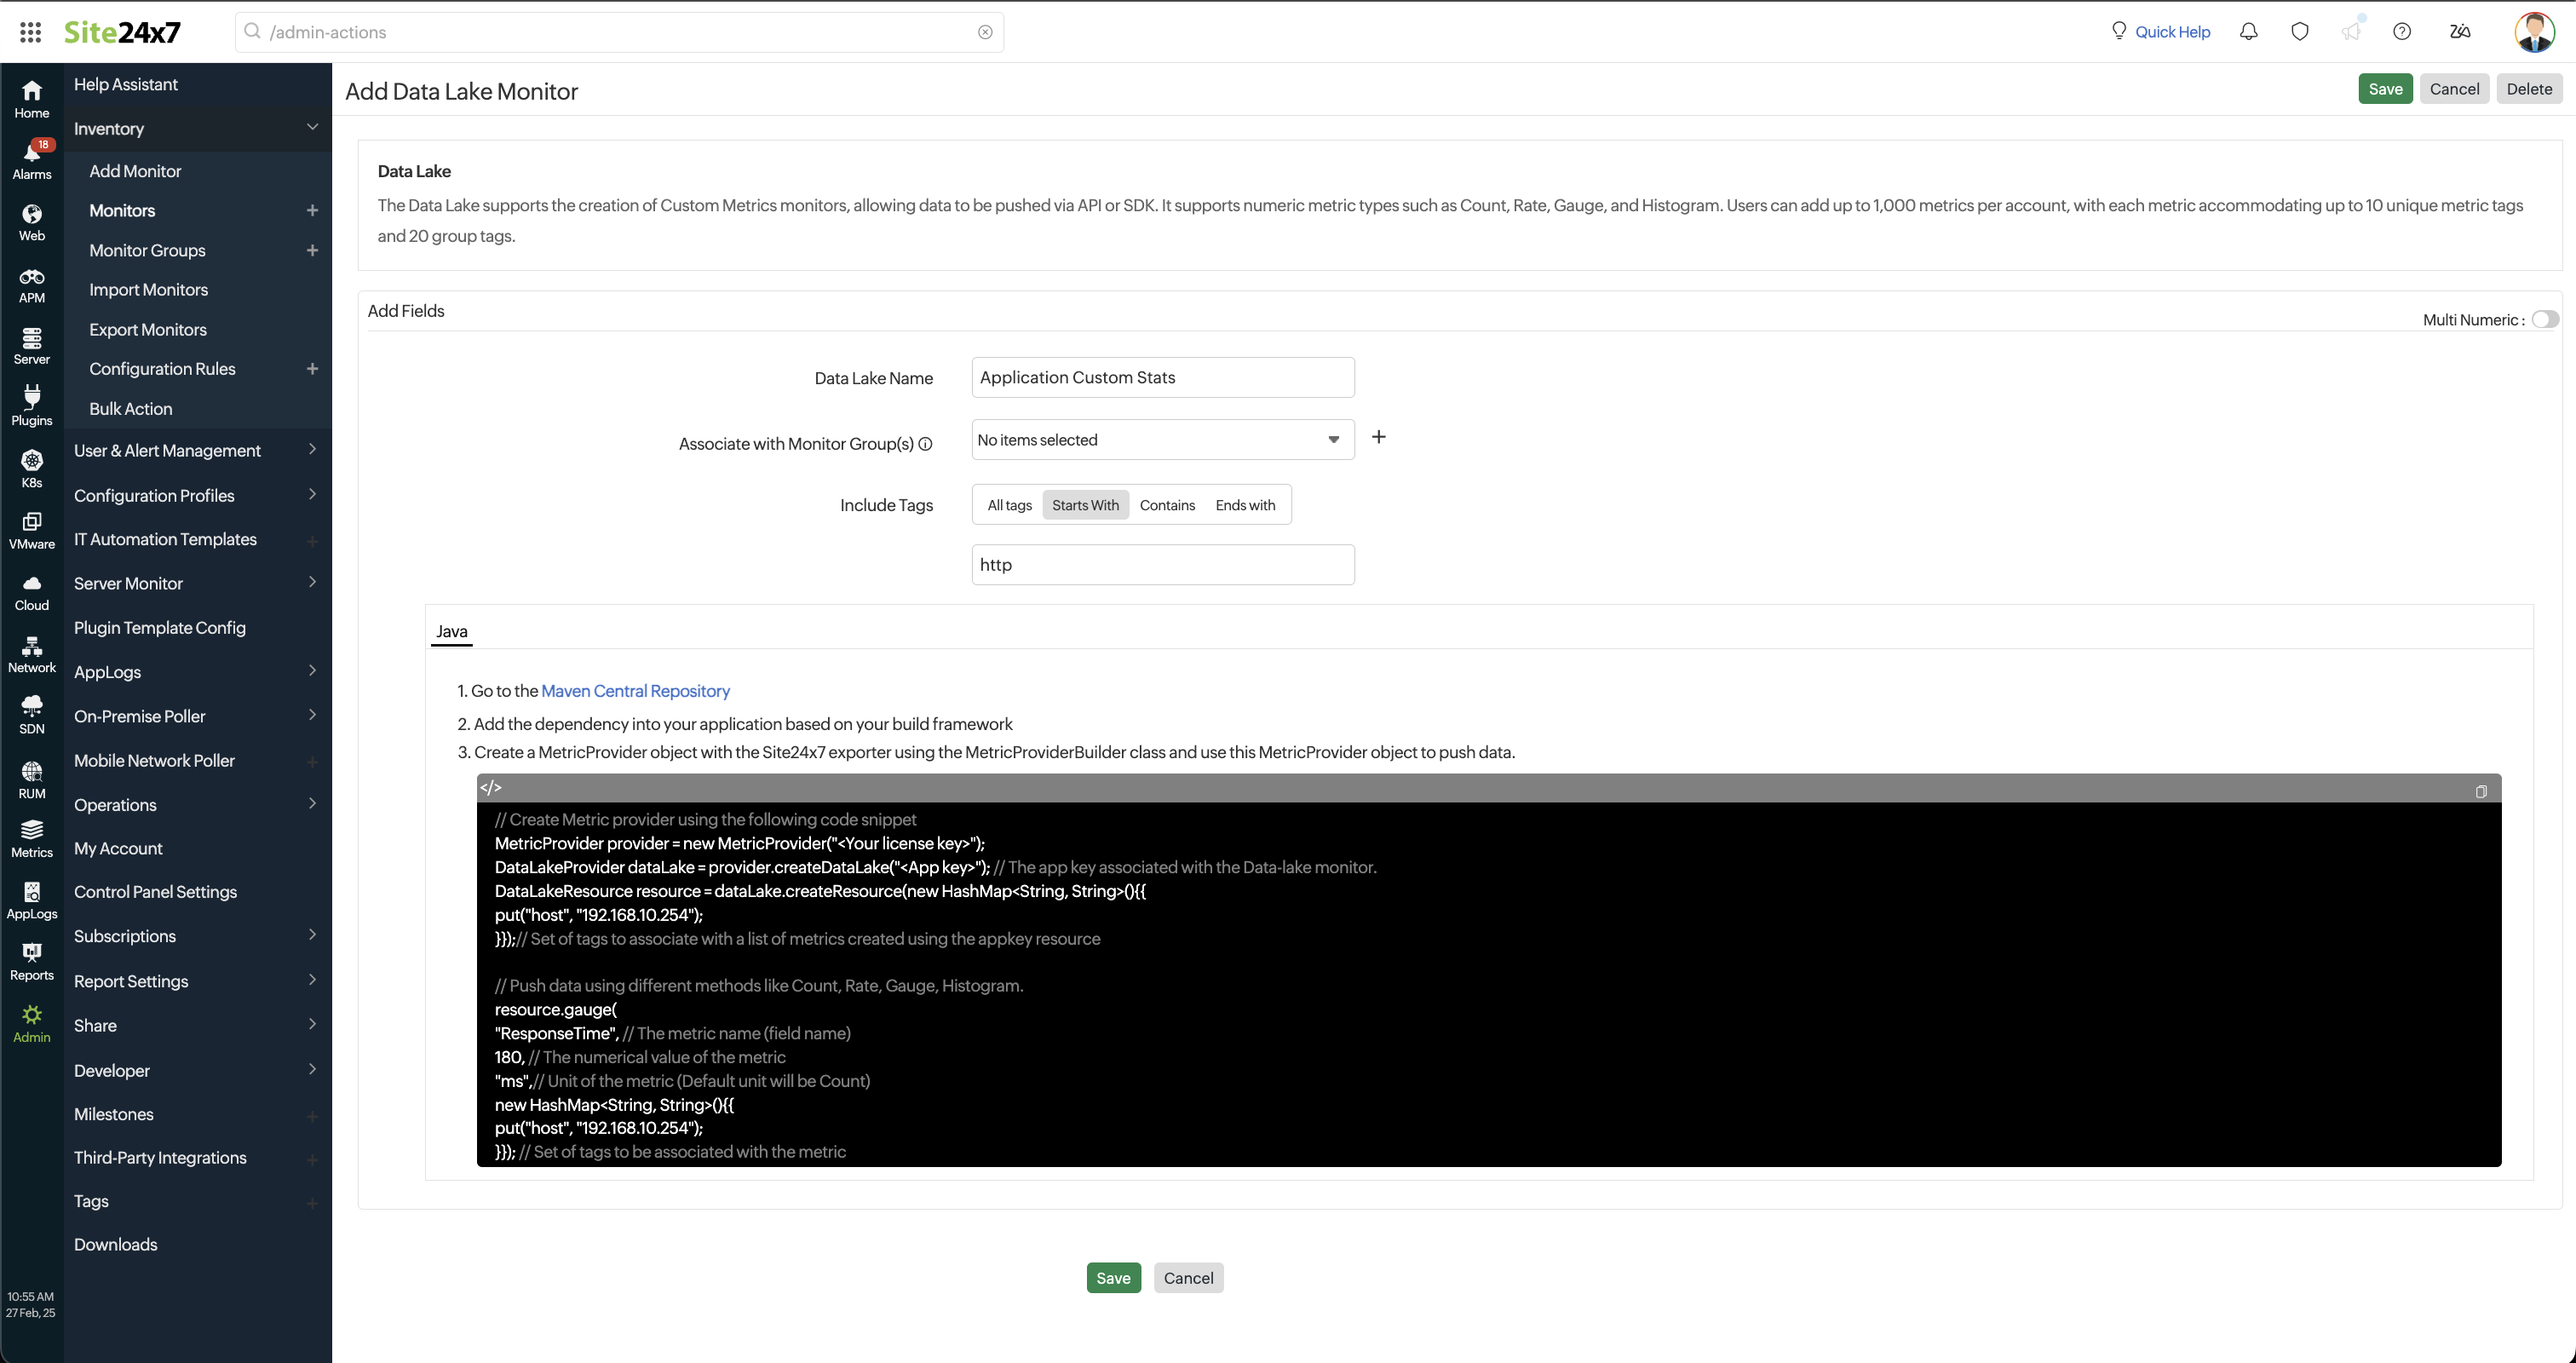
- In the Add Data Lake Monitor page, provide the following details:
- Data Lake Name: Provide a unique name for your monitor.
- Associate with Monitor Group(s): Choose a monitor group from the drop-down list to logically group your monitors. Refer to Monitor Groups for more details on creating groups.
- Include Tags: Select how you want to filter the data pushed via SDK/API.
- All Tags: Push all available data.
- Starts With: Push data that starts with a specific term.
- Contains: Push data containing a specific keyword.
- Ends With: Push data ending with a specific term.
- Click Save.
Import data to the created monitor
You can push data via SDK or API.
Push data via SDK
This option is used to send raw data (unaggregated data), and the aggregation will be done at our end.
Push data via Java SDK
Push data to Data Lake using Java SDK
Step 1: Add/Set up the SDK to your application
You must have the SLF4J jar in your application for logging purposes. If you haven't added the jar, please do so.
- Go to the Maven Central Repository.
- Add the dependency into your application based on your build framework.
NoteYou can also download and add the SDK jar to your application.
Step 2: Create the object of SDK MetricProvider
Create a MetricProvider object with the Site24x7 exporter using the MetricProviderBuilder class. This object is used to push metric data.
For a single application, a sole license key is applicable. Even if you create a new object within the same application, it will continue to utilize the initial license key rather than obtaining a new one.
// Create Metric provider using the following code snippet
MetricProvider provider = new MetricProvider("");
DataLakeProvider dataLake = provider.createDataLake(""); // The app key associated with the Data-lake monitor.
DataLakeResource resource = dataLake.createResource(new HashMap(){{
put("host", "192.168.10.254");
}});// Set of tags to associate with a list of metrics created using the appkey resource

// Push data using different methods like Count, Rate, Gauge, Histogram.
resource.gauge(
"ResponseTime", // The metric name (field name)
180, // The numerical value of the metric
"ms",// Unit of the metric (Default unit will be Count)
new HashMap(){{
	put("host", "192.168.10.254");
}}); // Set of tags to be associated with the metric
Step 3: Provide raw data to the SDK
Specify the accurate method to properly aggregate the values of the defined field.
Count
metricProvider.count(
    "<app key>", // The app key associated with the Data-lake monitor
    "db_write", // The metric name (field name)
    2.0, // Numerical value of the metric
    Collections.singletonMap("host", "192.168.10.254") // Set of tags to associate with the metric
);
Rate
metricProvider.rate(
 "<app key>",
 "disk_free",
  16868264.0,
  Collections.singletonMap("host", "192.168.10.254")
);
Gauge
metricProvider.gauge(
 "<app key>",
 "disk_free",
  16868264.0,
  Collections.singletonMap("host", "192.168.10.254")
);
Histogram
metricProvider.histogram(
 "<app key>",
 "disk_free",
  16868264.0,
  Collections.singletonMap("host", "192.168.10.254")
);
Where,
- <app_key> can be obtained from the Show Post URL option
- disk_free is the numeric field
- Collections.singletonMap ("host", "192.168.10.254") is the String field, which is optional
- The default values for units are as follows:
- ms for Time
- bytes for Size
- one for Count
Push data via Node.js SDK
Push data to Data Lake using Node.js SDK
Use the Node.js SDK to push custom metrics to the Site24x7 Data Lake for monitoring and analysis.
Prerequisites
- Node.js version 16 or higher
- Node Package Manager (NPM)
- Site24x7 account with a valid app key
Step 1: Install the SDK
Install the SDK in your project’s root folder using the following command:
npm install site24x7_datalake_sdk
Step 2: Configuration
Create or update the .env file:
Site24x7LicenseKey="your-license-key-here"
APP_PORT=3015
Step 3: Import the SDK and create a Data Lake
Require the SDK in your application:
const metrics = require('site24x7_datalake_sdk');
Replace appKey with the app key obtained from the Data Lake monitor:
const appKey = 'your-actual-app-key-here';
Create a Data Lake as follows:
const dataLake = metrics.createDataLake(appKey);
Step 4: Create resource tags
Create a resource with tags to associate with all metrics pushed using this app key:
const dataLakeResource = dataLake.createResource({
  resourcetag1: 'resourcetag1',
  resourcetag2: 'resourcetag2',
});
You can customize these tags according to your application requirements.
Step 5: Push raw metric data
Specify the appropriate metric type to ensure proper aggregation of values.
Count
Used to record event occurrences.
dataLakeResource.count({
  name: "event_occurrences",
  value: 10,
  unit: "events",
  tags: {
    source: "api",
    type: "user_action"
  }
});
Gauge
Represents a value that changes over time, showing the current state at any moment.
dataLakeResource.gauge({
  name: "memory_usage",
  value: 75,
  unit: "MB",
  tags: {
    server: "web-server-1",
    environment: "production"
  }
});
Rate
Used to record values measured over time.
dataLakeResource.rate({
  name: "requests_per_second",
  value: 250,
  unit: "requests",
  tags: {
    source: "load_balancer",
    region: "us-east"
  }
});
Histogram
Used to record statistical distributions.
dataLakeResource.histogram({
  name: "response_times",
  value: 120,
  unit: "ms",
  tags: {
    endpoint: "/api/users",
    method: "GET"
  }
});
Parameters
| Parameter | Type | Required/mandatory | Default | Description |
|---|---|---|---|---|
| name | string | Yes | - | The name of the metric |
| value | number | Yes | - | The value to record |
| unit | string | No | one | The unit of measurement |
| tags | object | No | {} | Additional tags for the metric |
Quick checks
- Run npm install to ensure all dependencies are installed
- Verify the license key and app key from Site24x7
- Check for the site24x7data folder in the application root directory for SDK logs
Push data via API
This option is used to push the aggregated data.
- Go to the data lake monitor listed and click on it.
- Hover over the hamburger icon (
 ) next to the monitor's name.
 - Select Show Post URL from the drop-down menu.
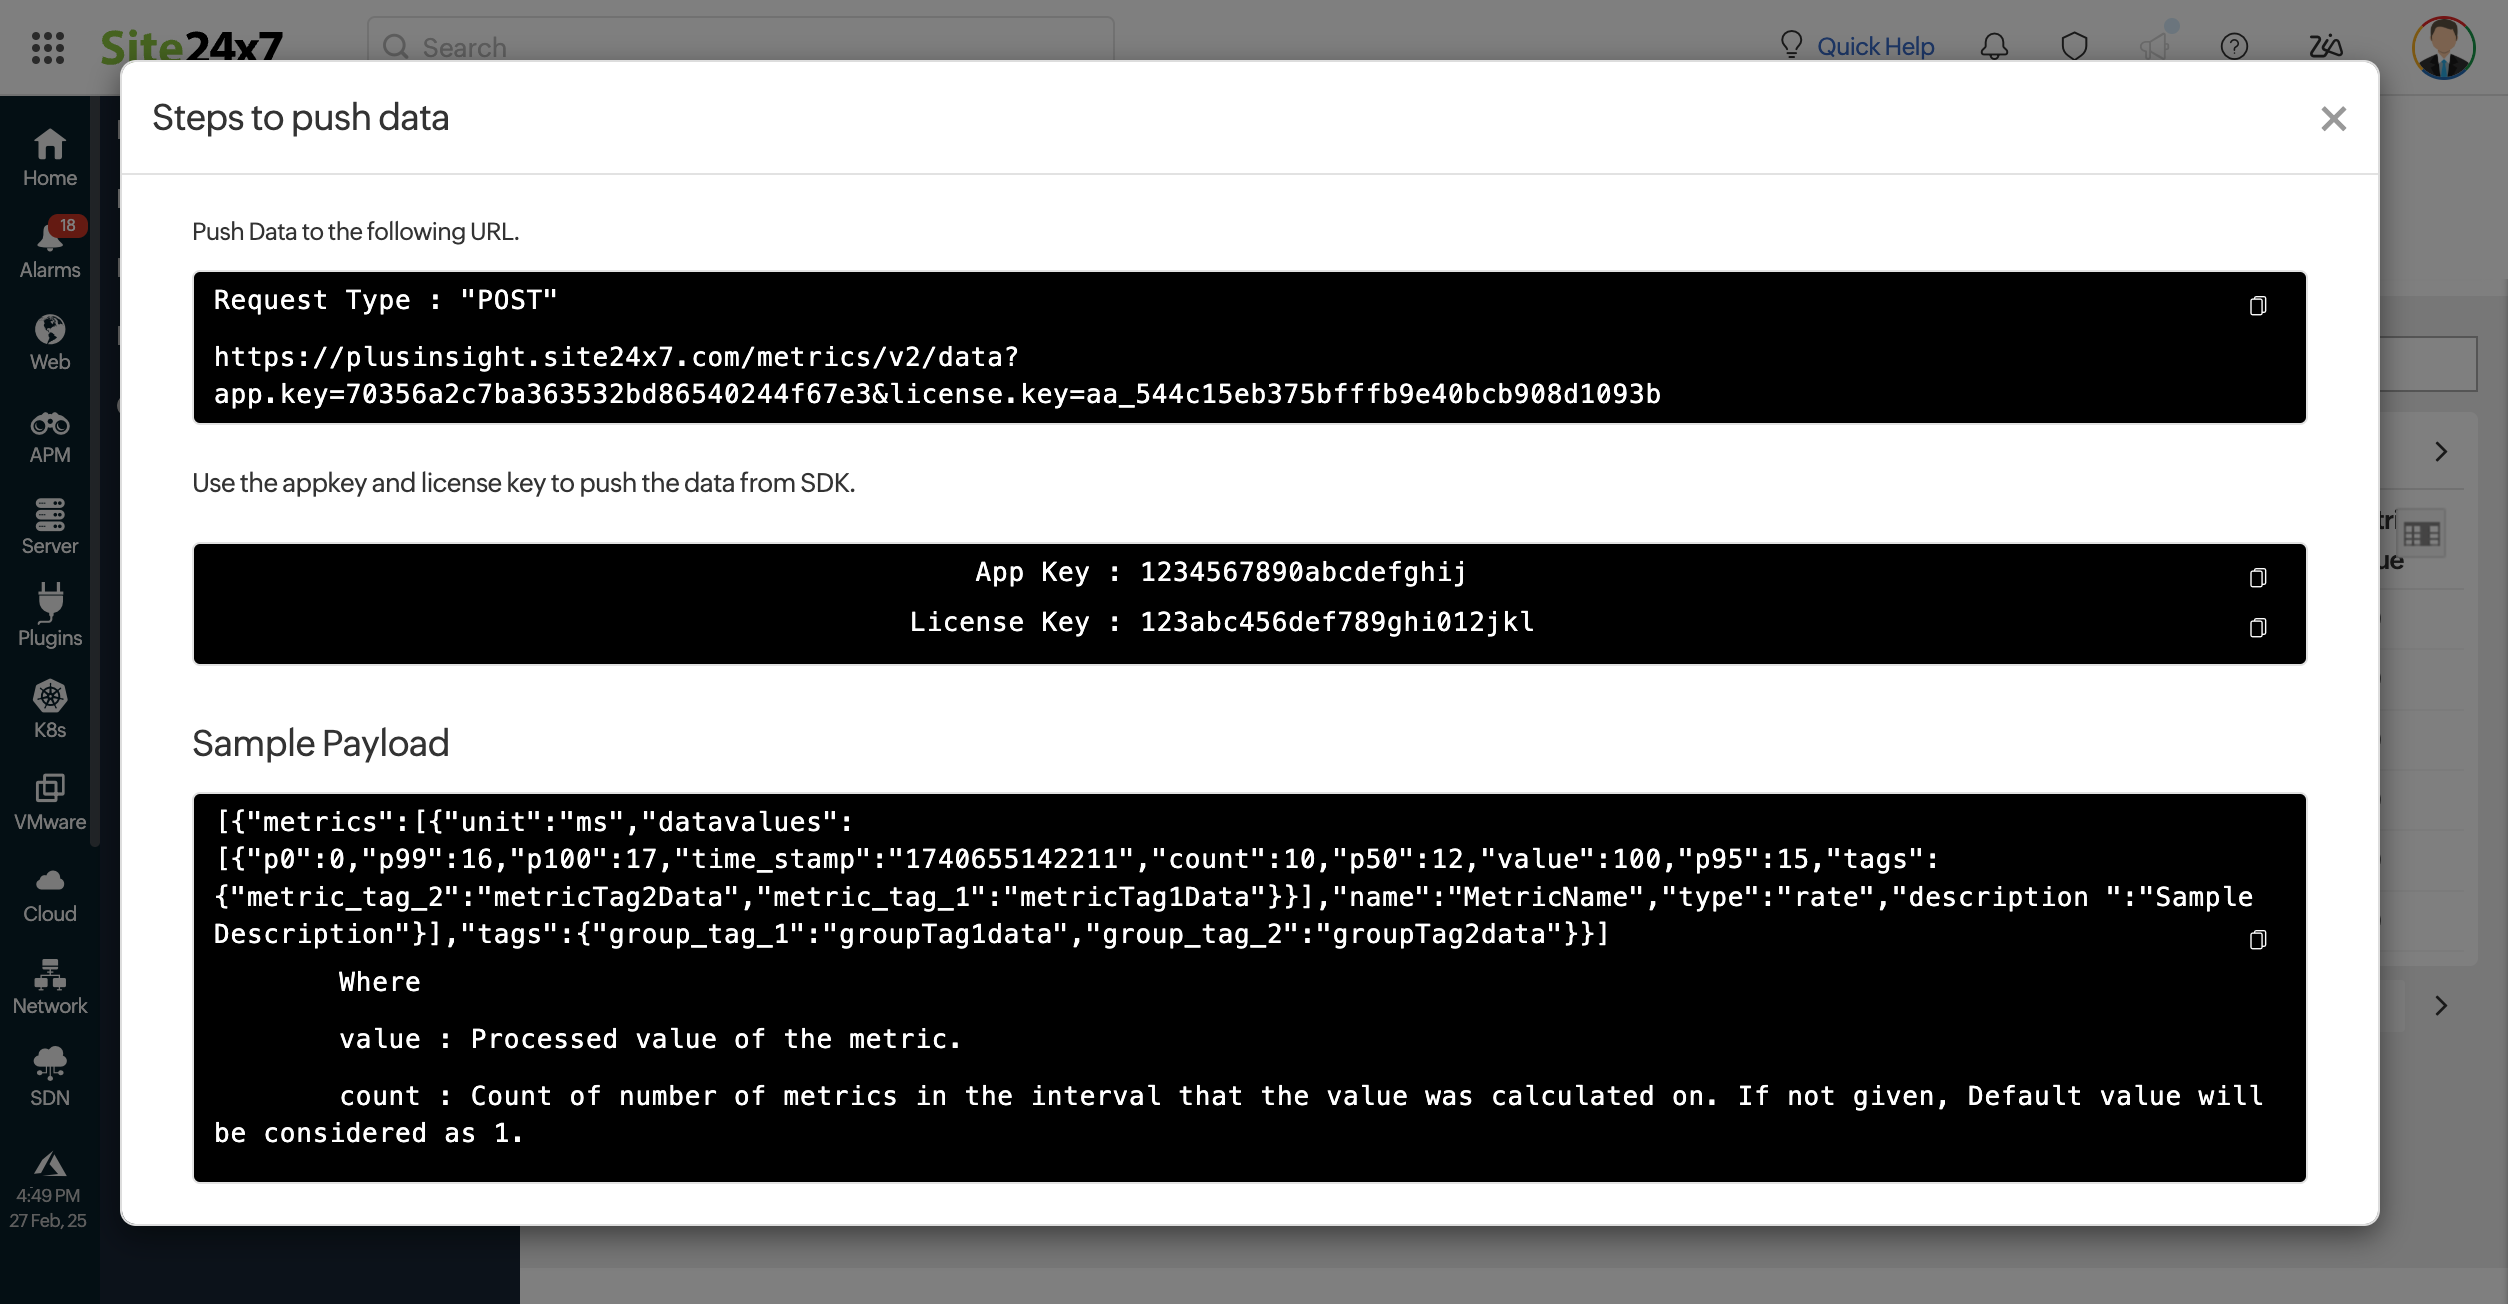
- Follow the on-screen instructions.
NoteSample Payload:
[
   {
      "metrics":[
         {
            "unit":"ms",
            "datavalues":[
               {
                  "p0":0,
                  "p99":16,
                  "p100":17,
                  "time_stamp":"1739341985265",
                  "count":10,
                  "p50":12,
                  "value":100,
                  "p95":15,
                  "tags":{
                     "metric_tag_2":"metricTag2Data",
                     "metric_tag_1":"metricTag1Data"
                  }
               }
            ],
            "name":"MetricName",
            "type":"rate",
            "description ":"Sample Description"
         }
      ],
      "tags":{
         "group_tag_1":"groupTag1data",
         "group_tag_2":"groupTag2data"
      }
   }
]
Where,
- value: Processed value of the metric.
- count: Number of metrics recorded within the interval used for value calculation. If not provided, the default value is 1.
Supported units
| Type | Supported units | Base unit |
|---|---|---|
| Size | bytes, kb, mb, gb, tb | bytes |
| Time | us, ms, sec, min, hr, day | ms |
| Count | one, thousand, lakh, million, billion, trillion | one |
- Even if the user sends values in different units (e.g., gb, min, billion), they will be automatically converted to the base units (bytes, ms, one).
- If the user sends some other units that are not listed in the above table, they will be automatically considered as Count and counted as unit one.